
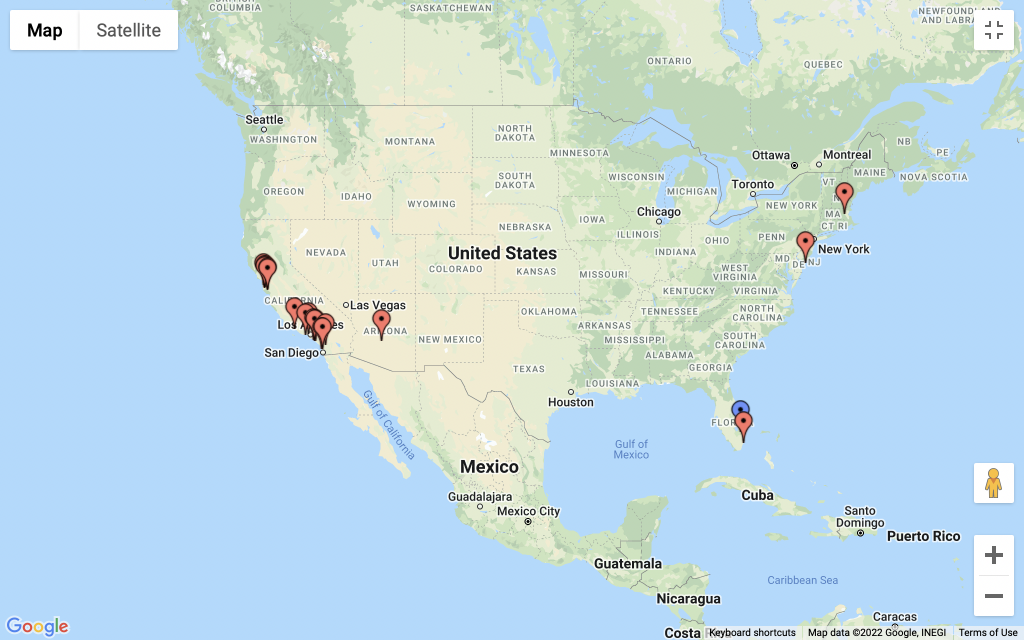
Should I buy or hold or sell? REMAP2.com consumes massive amounts of Real Estate data to identify and show on Google map all the up or down markets in America.
Clearly we are in a down market. If you can, build cash reserves and wait to buy. There will be more favorable conditions and opportunities to build your wealth in the future.
Where do the rich live? Start searching for cities with the highest median price values using these technical indicators. Property Types – Single Family Residential ; Region Type – Place/City; State Code – all; Time Range – 3 Months; Median Sale Price – Min $3,000,000; No Of Homes Sold – 5
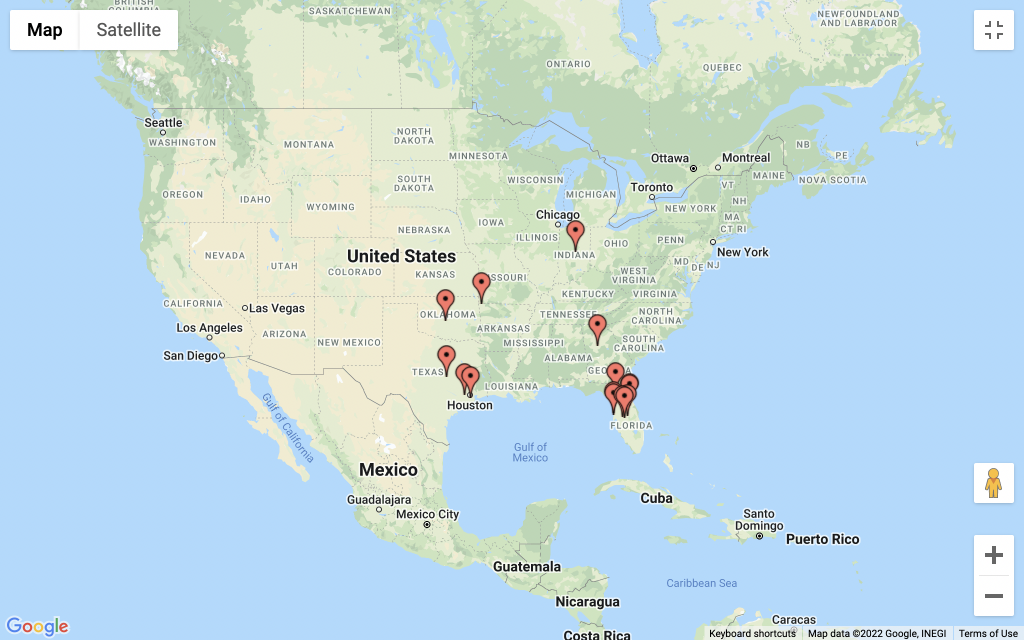
How to search for entry level flip markets. Search using these technical indicators. Property types – Single Family Residential; Region Type – Place/City; State Code – all; Time Range – 3 Months; Median Sale Price – Min $250,000 to $350,000; Median Sale Price YoY – Min 20 to Max 40; Median Days On The Market – Max 14; % Home Sold Above List – 0.3; No Of Homes Sold – Min 10
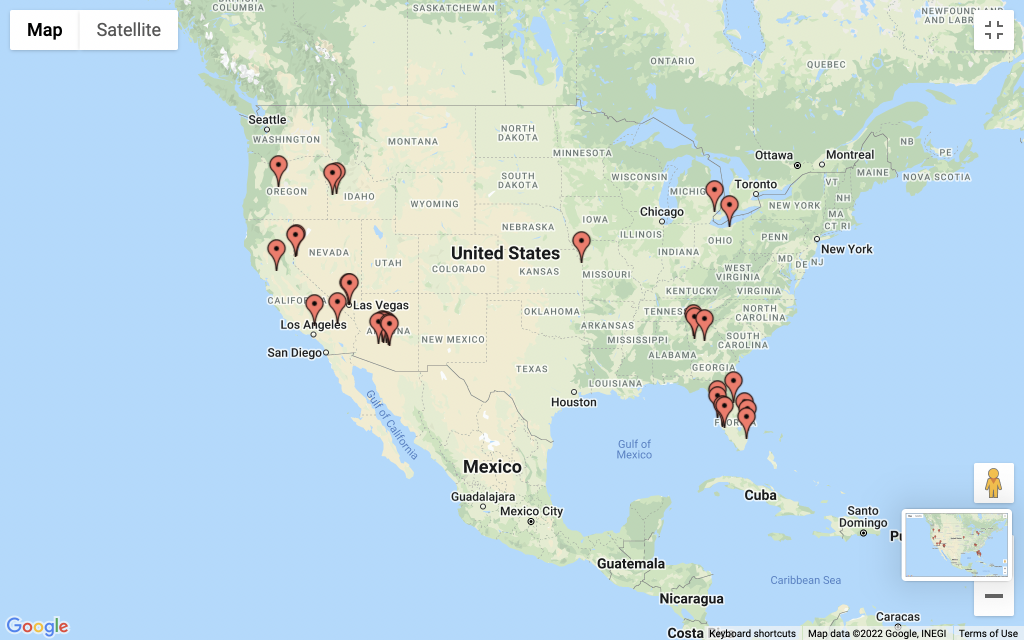
How to search for the highest appreciating buy and hold markets. Search using these technical indicators. Property types – Single Family Residential; Region Type – Place/City; State Code – all; Time Range – 10 Years; Median Price Appreciate or Depreciate – Price up 250% No Of Homes Sold – Min 100
HOW TO VIDEO
VIDEO PODCAST
MARKET NEWS
Published on February 10, 2022 by Tim Ellis
Frequently asked questions
about real estate market analysis
The final home sale price covering all homes with a sale date during a given time period where 50% of the sales were above this price and 50% were below this price.
The number of days between the date the home was listed for sale and when the home went off-market/pending sale covering all homes with an off-market date during a given time period where 50% of the off-market homes sat longer on the market and 50% went off the market faster. Excludes homes that sat on the market for more than 1 year.
The percent of homes sales with a sale price greater than their latest list price covering all homes with a sale date during a given time period. Excludes properties with a sale price 50% above the listing price or with a sale price 50% below the list price.
How many listings dropped their price in a given time period. Example 0.7 = 70% of listings dropped their price.
Total number of active listings on the last day a given time period.
The total number of homes that went under contract within two weeks of their listing date.
The most recent listing price covering all homes with a listing date during a given time period where 50% of the active listings were above this price and 50% were below this price.
When data are monthly, it is inventory divided by home sales. This tells you how long it would take supply to be bought up if no new homes came on the market.
Just wish to say your article is as astounding. The clearness for your put up is
simply nice and that i could suppose you are knowledgeable in this subject.
Well with your permission let me to take hold of your feed to
stay updated with approaching post. Thanks 1,000,000 and please carry on the enjoyable work.